If you’ve ever shopped for a perennial and seen a label like “Hardy in Zones 5-9,” you’ve probably wondered what that number actually means for your yard. In our guide to starting a vegetable garden from scratch, we mentioned that your hardiness zone and your local frost dates are two different things and shouldn’t be confused with each other. This guide is where we unpack that properly: what your zone number actually measures, how to look it up, why the map changed in 2023, and — just as importantly — what it can’t tell you.
What a USDA Hardiness Zone Actually Measures
The USDA Plant Hardiness Zone Map (PHZM) is, in the USDA’s own words, “the standard by which gardeners and growers can determine which perennial plants are most likely to thrive at a location.” It’s built around one specific measurement: the average annual extreme minimum winter temperature for a given area, displayed as 10°F zones (Zone 5, Zone 6, Zone 7, and so on) and 5°F half-zones within each of those (6a and 6b, for example).
In plain terms, this is an estimate of how cold your coldest winter nights typically get, averaged over many years. It exists so nurseries, seed companies, and gardeners have a shared, standardized way to gauge whether a perennial plant — something you’re expecting to survive winter and come back year after year — is likely to make it through the cold where you live.
It’s worth sitting with that word “perennial” for a second, because it’s the whole point of the map. Hardiness zones are especially useful when you’re evaluating perennial plants — trees, shrubs, and perennial flowers you expect to survive winter and return in subsequent growing seasons. For annual vegetable planting, use local frost-date and growing-season information rather than relying on the PHZM alone; we’ll come back to that distinction in more detail below.
How to Find Your Zone
The official map lives at planthardiness.ars.usda.gov. The fastest way to find your zone is to enter your ZIP code in the search box on that site; you can also click directly on the interactive map to check a specific location, or download state-level maps if you’d rather browse visually.
A couple of practical notes on using it:
- If you’re going by a plant tag, seed catalog, or an older printed zone chart, double check it reflects the current map — anything based on the 2012 edition may show a different zone than the current one for the same address.
- The USDA describes these maps as “general guides for growing perennial plants,” built from average lowest temperatures, not the single coldest night you’ll ever actually experience. Microclimates — a sheltered courtyard, an exposed hilltop, a spot near a heat-radiating wall — can push your real conditions warmer or colder than your zone number alone would suggest.
Why Two Gardens in the Same Zone Can Behave Differently
Two yards in the exact same hardiness zone won’t necessarily treat your plants the same way. The USDA’s own guidance on using the map is direct about this: “Wind, soil type, soil moisture, humidity, pollution, snow, and winter sunshine can greatly affect the survival of plants.” It adds one more factor worth calling out for anyone gardening through hot summers, too: “Warm season heat and moisture balance are particularly important in this regard.”
A few examples the USDA gives:
- Winter sun: “plants that require partial shade that are at the limits of hardiness in your area might be injured by too much sun during the winter because it might cause rapid changes in the plant’s internal temperature.”
- Soil moisture: “Plants that might otherwise be hardy in your zone might be injured if soil moisture is too dry in late autumn, and they enter dormancy while suffering moisture stress.”
- How long the cold lasts, not just how cold it gets: “Many plants that can survive a short period of exposure to cold may not tolerate longer periods of cold weather.”
- Humidity: “High relative humidity limits cold damage by reducing moisture loss from leaves, branches, and buds. Cold injury can be more severe if the humidity is low, especially for evergreens.”
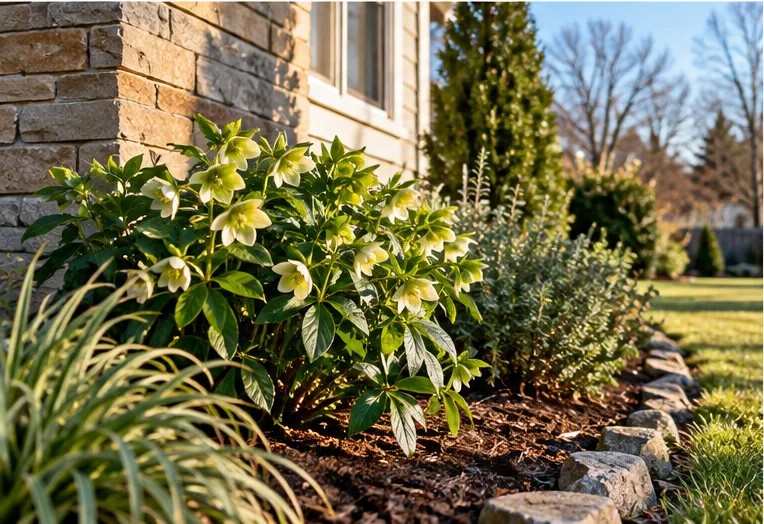
Then there’s the microclimate effect, which is exactly why the map’s own resolution has a floor. The current map is built from a digital grid with cells “about a half mile on a side” — drawn, per the USDA, at “the most detailed scale (1/2 mile square) to date” for this map. That’s a real improvement in local accuracy, but it still can’t capture every backyard-scale variation. The USDA specifically calls out microclimates — “fine-scale climate variations” — as something the map can’t resolve: it notes these “can be small heat islands—such as those caused by blacktop and concrete—or cool spots (frost pockets) caused by small hills and valleys,” even within a single mapped zone.
None of this makes the zone map unreliable — it just means it’s one input, not the whole picture. Your zone gives you the baseline; wind exposure, soil, moisture, and the shape of your own yard fill in the rest.
Why the 2023 Map Changed
The current version — officially the 2023 USDA Plant Hardiness Zone Map — was jointly developed by USDA’s Agricultural Research Service (ARS) and Oregon State University’s PRISM Climate Group, and it’s the first update since the 2012 map. It’s built from a larger, more recent dataset: data from 13,625 weather stations, using a 1991-2020 averaging period, which the USDA notes “aligns with the period currently in use by climatologists to describe baseline climate ‘normals’ in the U.S.”
The mapping technology itself, PRISM, is described by the USDA as “a highly sophisticated climate mapping technology developed at Oregon State University.” Rather than simply drawing lines between weather stations, PRISM “estimated the mean annual extreme minimum temperature for each grid cell…by examining data from nearby stations; determining how the temperature changed with elevation; and accounting for possible coastal effects, temperature inversions, and the type of topography (ridge top, hill slope, or valley bottom).” That’s part of why the 2023 map is described as more detailed than earlier versions — it’s accounting for a lot more local geography than a simple average would.
So how does it compare to 2012? The USDA states that “the new PHZM is generally about one quarter-zone warmer than reported in the 2012 PHZM throughout much of the United States, as a result of a more recent averaging period (1976-2005 vs. 1991-2020).” That’s a real, documented shift — but the USDA adds an important caveat worth reading carefully: “some of the changes in the zones are the results of additional data sources and improved interpolation methods, and these zone shifts can sometimes result in a cooler, rather than warmer, zone.” In other words, if your zone changed between the 2012 and 2023 maps, that isn’t automatically evidence of local warming on its own — better station coverage and a more detailed mapping method account for part of it too, and in some places the change actually went the other direction.
What Your Zone Does Not Tell You
This distinction is important for first-time gardeners. Your hardiness zone number is not a frost date calendar, and it’s not a planting schedule. Go back to the USDA’s own description of the map and its intended use, and you won’t find any mention of frost dates or planting timing anywhere — the map is defined entirely in terms of winter minimum temperatures, for the specific purpose of judging perennial plant survival.
That means your zone number, on its own, can’t tell you:
- When your last spring frost or first fall frost typically happens
- When it’s safe to transplant seedlings outside
- How long your growing season actually is
Those are all genuinely useful things to know before you plant — they’re just a different piece of information, and one you’ll usually need to get from local frost-date records or your state’s Cooperative Extension office, not from the Hardiness Zone Map. If you’ve read our beginner’s guide to starting a vegetable garden, this is the same distinction we flagged there: check your hardiness zone for perennials, and check your local frost dates separately when you’re timing out annual vegetables. To turn your frost date into actual sowing dates, see our frost-date seed-starting calendar.
Common Misunderstandings
“A lower zone number means a harder climate to garden in”
Not exactly. A lower number just means colder average winter minimums — it isn’t a verdict on how good your garden will be, only on which perennials can survive the winter there. Plenty of resilient, easy-to-grow plants exist for cold-winter zones; you’re just selecting from a different plant list than someone gardening in a warmer zone.
“My zone tells me what will grow well for me overall”
Your zone tells you what can survive winter where you live. Whether a plant actually thrives also depends on summer heat, humidity, soil type, rainfall, and available light — none of which the Hardiness Zone Map is designed to capture. Two towns in the same zone can still be very different places to garden.
“Zone labels matter for my vegetable garden the same way they matter for perennials”
This one’s the opposite of a misunderstanding — it’s worth remembering explicitly. Hardiness zones exist specifically to describe winter survival for perennial plants. For annual vegetables, which you replant each season, use local frost-date and growing-season information rather than relying on your hardiness zone alone.
“A zone shift from 2012 to 2023 means my climate got warmer”
Maybe, but not necessarily — and not on its own. As covered above, the USDA attributes part of the shift to a more recent averaging period, and part to more weather stations and improved interpolation, which can shift a zone in either direction. Your zone changing is not, by itself, proof of a warming trend at your specific location.
Frequently Asked Questions
What zone am I in?
Enter your ZIP code at planthardiness.ars.usda.gov to see your specific zone and half-zone (for example, 6a or 6b).
Did my zone actually get warmer in the 2023 update?
Possibly, but not necessarily from a warming climate alone. The USDA attributes much of the shift to a more recent averaging period, combined with more weather stations and improved mapping methods — and it explicitly notes that some areas’ zones shifted cooler, not warmer.
Does my hardiness zone tell me when to plant my vegetable garden?
No. It only describes winter minimum temperatures, for judging whether perennial plants will survive winter. For planting timing, you’ll want your local frost dates, which we cover in the context of starting a vegetable garden from scratch.
Is the Hardiness Zone Map exact for my specific yard?
Not perfectly. The USDA itself describes it as a general guide based on average lowest temperatures, not the coldest night you’ll ever see, and local microclimates can push your real conditions warmer or colder than the map alone suggests.
Why does the zone matter if I’m only growing vegetables?
The USDA PHZM is designed primarily as a guide for perennial plant hardiness. For annual vegetable planting dates, use local frost-date and growing-season information rather than relying on the hardiness zone alone. Where the zone does matter for a vegetable gardener is with perennial edibles you plant once and expect to come back, like asparagus, rhubarb, or fruit bushes and trees.